MiSleep
MiSleep is for EEG/EMG signal processing and visualization.
The name MiSleep is from ‘Mice Sleep’ and also sounds like ‘my sleep’.
![]()
Here we only introduce the GUI of MiSleep. Github repo
Table of Contents
Get start
pip install misleep

# Or use
pip install --upgrade misleep
# to update the latest version
Find the directory where you installed misleep, run
python -m misleep
Basic usage
Prepare work
1. Data file
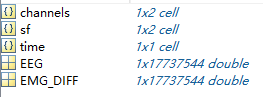
Here we suggest to use .edf or .mat format data. EDF is the European Data Format. MAT is the data format from matlab. Consider that EDF is a standard data format (see edfplus), here we only show how to grab the MAT format data for MiSleep (use data.mat for example).
data.mat should be a structure of matlab, each channel of data shoulf be a column/row of single/double data. And channel argument contains the channel names for each channel data. The sf argument contains the sample rates for each channel data. time is the acquistion time of the data. See example below.
2. Annotation file
About annotation file, you need to create a new .txt file.
3. Auto Stage
We trained a model based on time domain features and frequency domain features, with a lightgbm model. The overall accuracy for NREM and Wake is more than 90% and for REM is over 80%. Currently the results predicted by the model is rather than fragmented, we will add some constraints to make it better.
To use the auto stage, check the tool menu, click the Auto Stage, and fill the checkbox with your own data (select the EEG and EMG channel for prediction). The EEG site can be parietal or frontal (Just roughly where your EEG electrode is), which may improve the accuracy of the model a little bit.
Preview data
Load data and annotation files using the File menubar, or use shortcut.
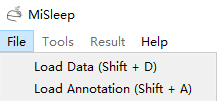
MiSleep will show the data and annotation automatically after the loading.
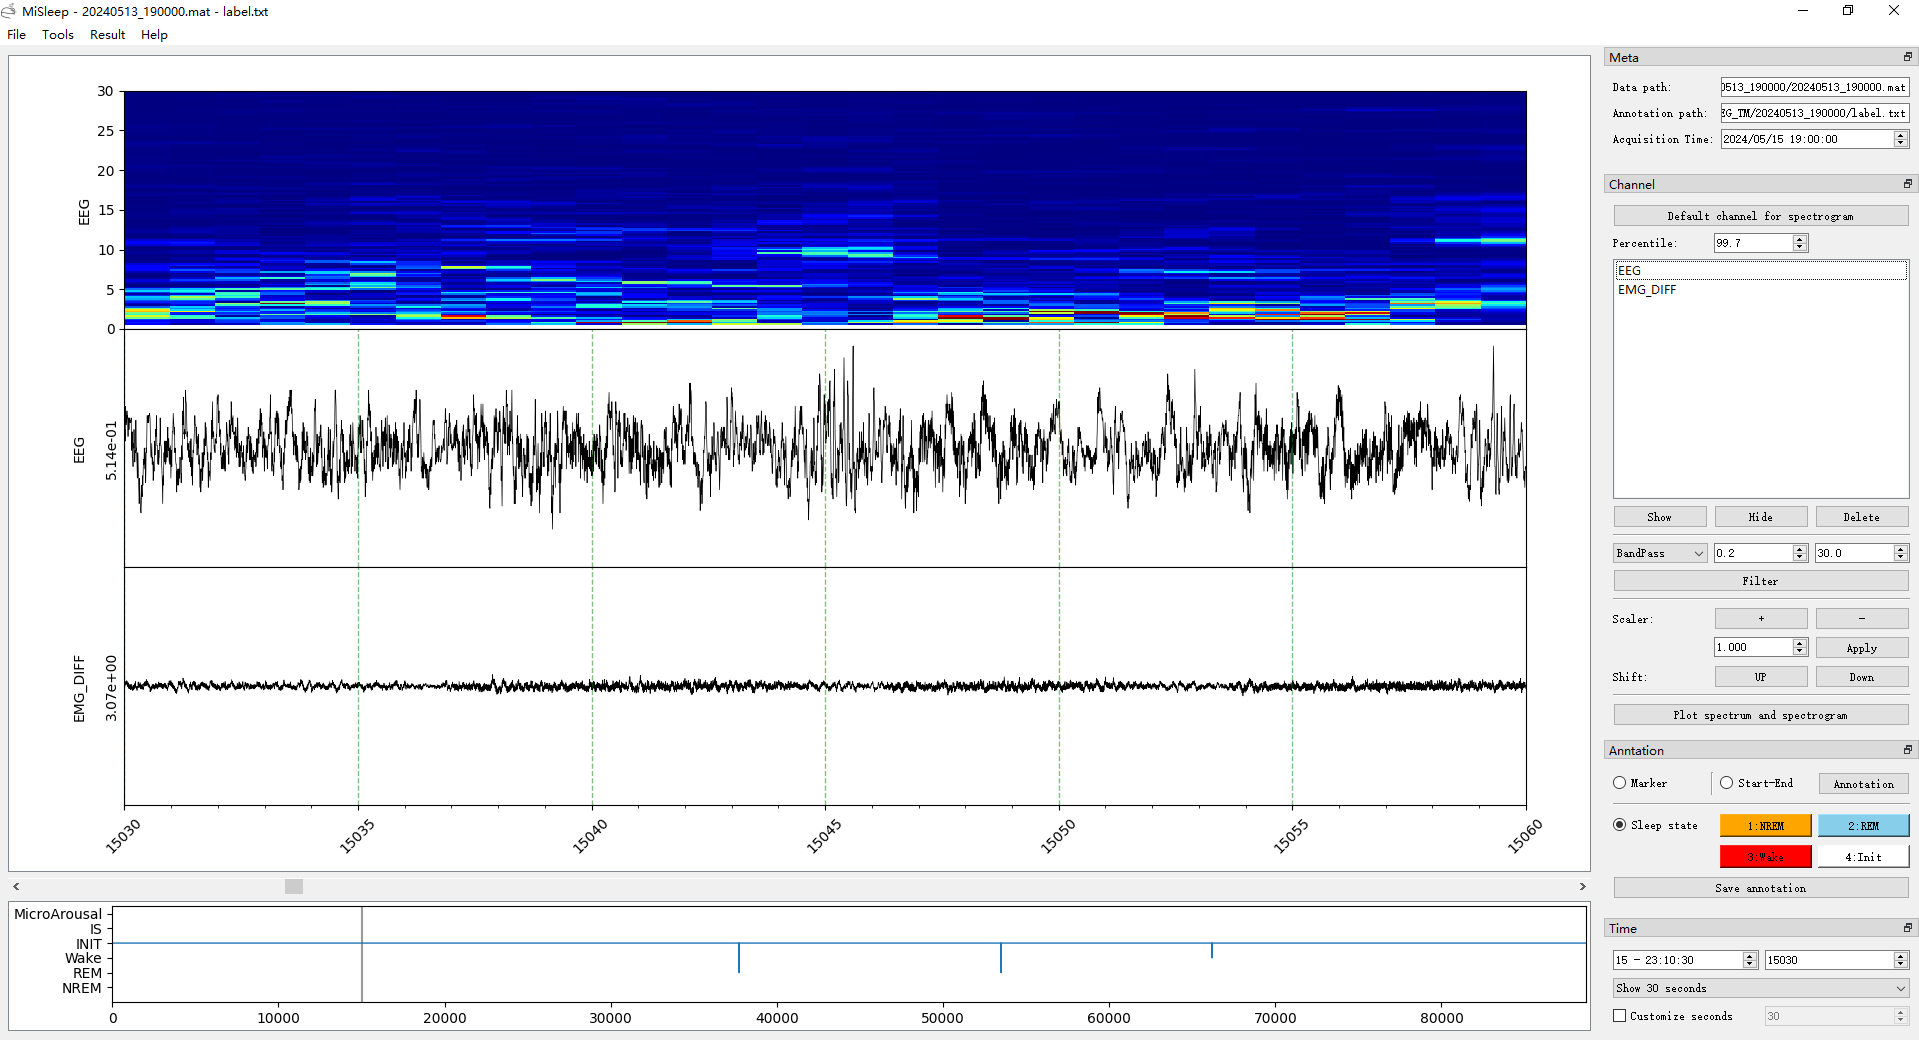
The window contains with two parts, the visualization part and tool part.
Visualization part
Three main panels, the spectrogram panel, the signal panel and hypnogram panel.
Tool part
Meta dock
Here we display the meta infomation of your data, including the data path, annotation path and data acquisition time.
Channel dock
These tools are based on one/multiple channel data. Default channel for spectrogram can set the selected channel for spectrogram, and the percentile editor can set the percentile of spectrogram heatmap.
Then it’s List View for Channel, it will display all the channel names, and you can select one or multiple channel for the following operations. Notice that some tools are only based on one channel, e.g., Default channel for spectrogram. The three buttons (Show, Hide, Delete) can do the corresponding operations with channel list.
Four kinds of basic filter can be applied to channel data, the filter functions are done with scipy.signal.filtfilt.
Scaler and shift part can adjust the channel visualization, zoom up/down or shift up/down the channel selected.
Plot spectrum and spectrogram is not only based on the selected channel, also need to select a start-end area in sleep state annotation mode, see Annotation dock.
Annotation dock
There are three modes of annotation: Marker, Start-End, Sleep state, with three radios.
Marker
Single time point annotaion, will pop up a dialog to choose which annotation to apply.
Start-End
Choose a start end area in ms level, so there are more precise event can be annotated. After choosing start end area, use the Annotation button or a for shortcut, you can choose a label for the selected start end area. Different start end area can overlap.
Sleep state
A roughly mode campare to Start-End mode, the temporal resolution is s. And no overlap between states. The default states here are NREM, REM, Wake, Init, and you can self-define other state in the config.ini file. Different state will display as different color (relate to the button color and the color set in config.ini) in the visualization part.
Time dock
Time configuration for signal visualization part. The absolute timestamp based on the acquisition time. The second time relative to the start time. These two can help you locate the time point.
The dropbox can select the time range to show of current window. And the custom editor can set the second for the time range of current window.
Menu tool
Tools
Add Line can add horizontal line in the channel signal of visualization part.
Event Detection can detect the SWA (Slow-Wave) activities and Spindle activities based on selected channel data.
Result
Transfer Restult can transfer the annotation file (.txt) to a excel file, which is more convenient for downstream analysis.
State Spectral can exoprt the spectral of different states in the sleep state mode.
Config file
We use config.ini for MiSleep configuration. It’s under the misleep project folder, you can easily find and self-define it.
The default of config file is as followed:
[gui]
version = XXXXX
updatetime = XXXXXX
marker = ['slow_wave', 'add water', 'third']
startend = ['NREM', 'REM', 'Wake', 'Spindle', 'SWA', 'start end label', 'start end label']
statemap = {"1": "NREM", "2": "REM", "3": "Wake", "4": "INIT", "5": "IS", "6": "MicroArousal"}
statecolor = {"1": "orange", "2": "skyblue", "3": "red", "4": "white", "5": "green", "6": "pink"}
startendcolor = {"NREM": "orange", "REM": "skyblue", "Wake": "red"}
statecolorbgalpha = 0.1
markerlinecolor = "red"
startendlinecolor = "blue"
openpath = E:
The marker and startend list contains the annotations in the Marker and Start-End mode respectively.
The statemap and statecolor is for Sleep state mode. The number should be an ascending integer start from 1, and support 9 states at most. The number is for the shortcut of state annotate, and for hypnogram plot. The color in statecolor dict, is the color of each state display in the signal area of visualization part. See gif below.
Note: only the NREM, REM, Wake and Init got the button in the sleep state annotaion area, the other states in the statemap can only annotate with shortcut, which is the number of them.
statecolorbgalpha is the alpha value of state color, which is the degree of transparency.
startendcoloe is the color of lines in the Start-End mode, relate to the startend list here.
markerlinecolor and startendlinecolor are the default line color for Marker and Start-End mode respectively.
openpath is the default path to open in the MiSleep GUI, and after each browser, the path will update.
Install MiSleep
To install misleep, you need to download the miniconda, for windows only download this and install it.
- Create a new environment with conda. Open the cmd (terminal if you use macOS), use the following commands:
# Create a environment for misleep conda create -n misleep python=3.9 # activate the environment conda activate misleep # install the misleep pip install misleep - Now you can use the misleep by commands.
# enter the path you install the misleep # First you need to enter the disk you install miniconda, like me 'E:', so I just enter E: E: # Go to the directory you install miniconda cd PATH_YOU_INSTALL_MINICONDA # Go to the directory you install misleep, if you are already in the miniconda path cd envs/misleep/Lib/site-packages # Use python to run misleep python -m misleep - For quickly start misleep, you can write a script, just create a new .txt file, and enter the following contents:
# go to the directory you installed misleep
E:
cd PATH_YOU_INSTALL_MINICONDA/envs/misleep/Lib/site-packages
call conda activate misleep
python -m misleep
Save the file and change the extension name to .bat or .cmd, then you can open it by double click.
:)