Misleep Manual
![]()
MiSleep is an easy-to-use software for sleep EEG/EMG data scoring and analysis.
Table of contents
Installation
The installation of MiSleep is very easy, what you need to do is just unzip the MiSleep.rar to your target directory.
Launch MiSleep
Start MiSleep by clicking on the MiSleep.exe in the MiSleep folder. MiSleep may take some time to show up, please be patient!
Initial window
Load data
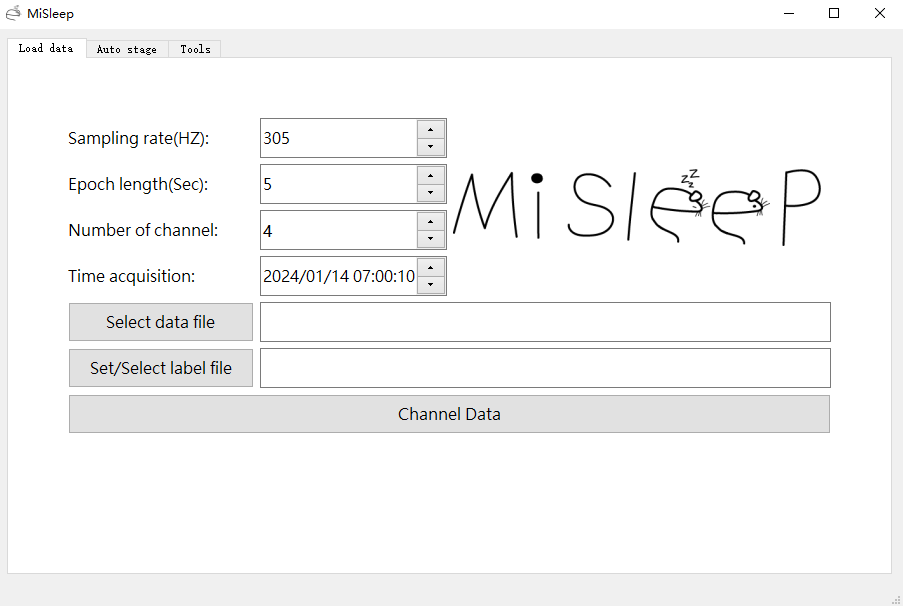
The initial window of MiSleep will show up, now we are in the Load data part.
-
You need to set the sampling rate to your own, which will be stored in the
storesListing.txtif you use TDT’s synapse for recording. -
The epoch length is for auto staging, here it’s only for a better signal visualization experience. Default is 5 seconds, you can just keep it.
- Number of channel is an important parameter, it represents the number of channel in your data. This is usually not the channel number when you are recording, it is the channel number when you use the matlab scripts to save your data in
.matformat. -
e.g., You recorded 1 EEG, 2 EMG and 1 REF in synapse, and when you are extracting data in matlab, the output data will have 1 EEG, 2 EMG, 1 differential of EMG, and 1 REF, so it’s 5 channels totally.
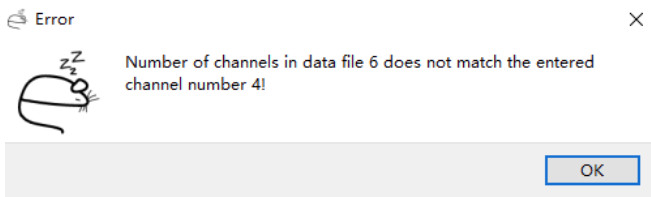
- If your channel number is incorrect, MiSleep will raise an error, see the picture below. It means there are 6 channels in your data, but you entered 4.
-
Time acquisition is also a very important parameter, it is when you start recording data. This datetime will be stored in the
LABEL.txt, and the following analysis will all based on it. Default is the time you opened MiSleep. It will be stored in thestoresListing.txtfile if you use TDT’s synapse for recording. -
Select a data file by click the
Select data filebutton, the data should be.matformat. -
Select a label file if exist, or create a new label file. Note: The
time acquisitiononly write into the label file when it is empty. If you select an exist MiSleep label file, then there is an acquisition time in it already, and it won’t be modified. So it’s important to double check the acquisition time when you set a new label file. -
Click the Channel data button, you will open the main window of MiSleep. Note: One
initial windowcan only open onemain window, which means before you click thechannel databutton, ensure that there is nomain windowopened from thisinitial window.
Auto stage
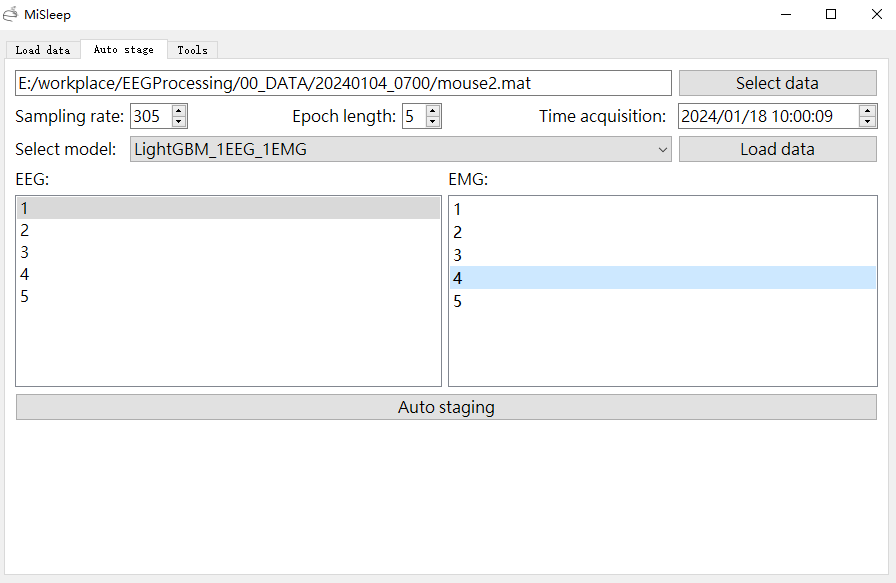
In the Auto stage part, you can use the lightGBM (currently) model to automatically score the sleep EEG/EMG data.
-
Choose a data file, set the sampling rate, epoch length and time acquisition, they are all the same with those we mentioned in the previous section. here the time acquisition is also very important.
-
Select a model to do prediction, currently only two lightGBM models are available. Click the
Load databutton to load data from the data file you selected. -
All channels will show in the channel list view, choose one for EEG and another one for EMG. Here the two models both need 1 EEG and 1 EMG for input.
-
Click the
Auto stagingbutton to do auto scoring. It takes about 30 seconds, please be patient. Then it will pop up a file browser, you need to choose a empty.txtfile to save the labels. -
After auto staging, the data in the memory will be clean, so the channel list view will be empty. Which means if you want to do prediction again, you should click the
Load dataagain.
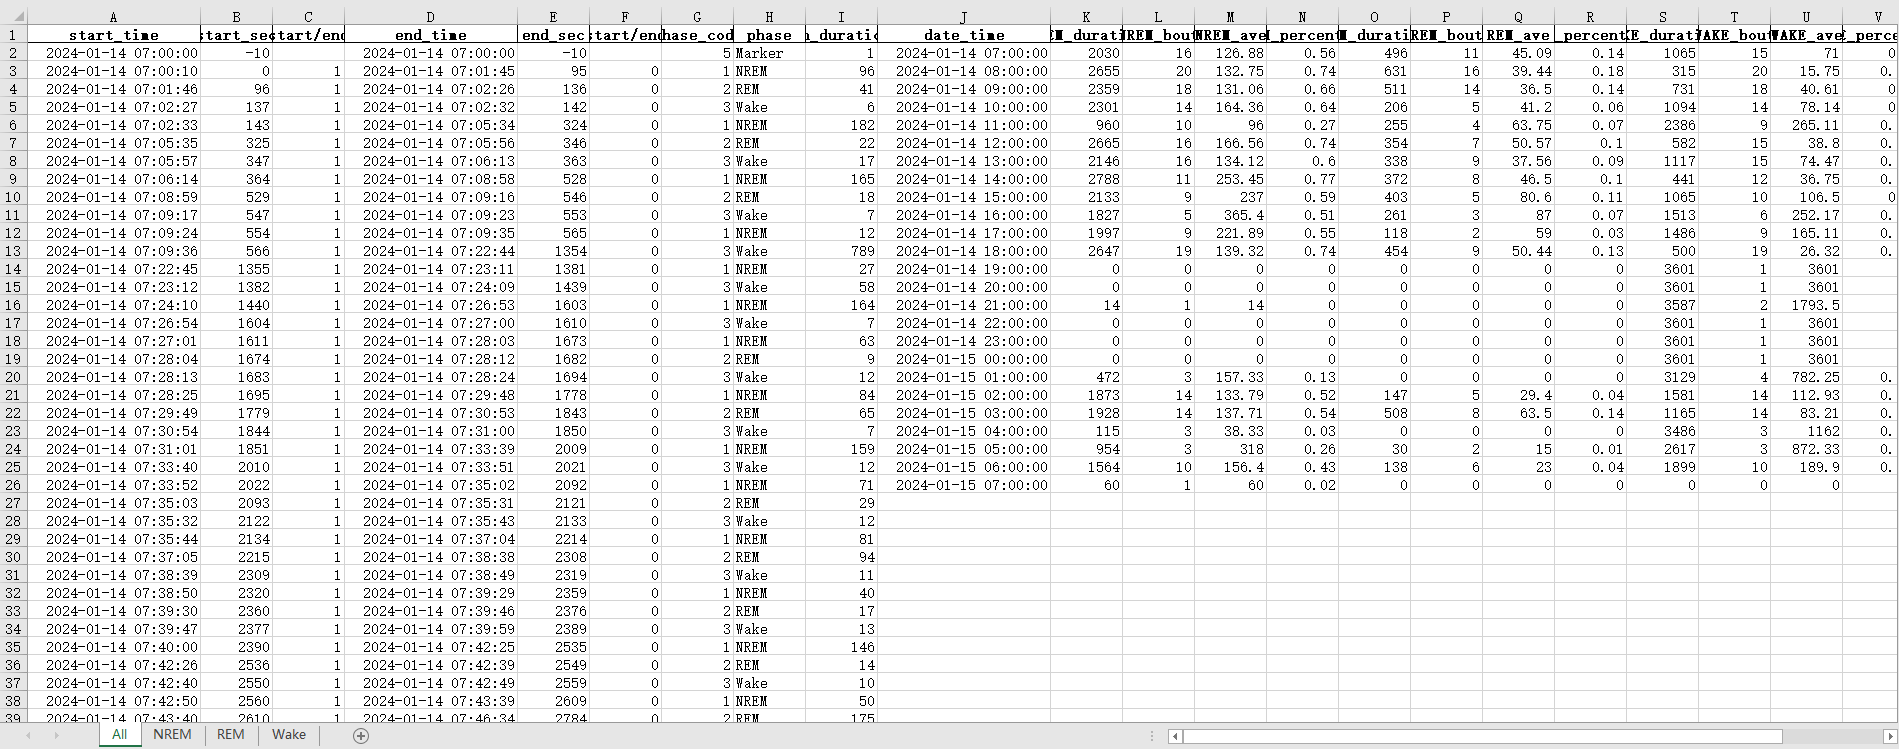
Tools
Here we have two useful tools currently, one can transfer the label file into a excel file, while another can help us get the hypnogram.
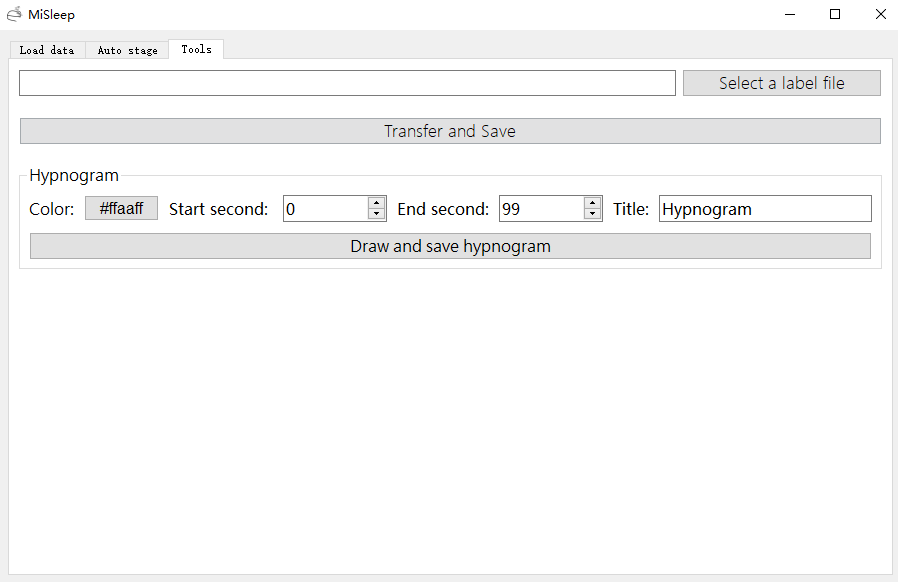
- Select a MiSleep label file, and output a
.xlsxfile. The output excel file have 4 sheets most of the case. The first sheet is all states’ analysis, each sleep bout gets the start and end datetime, relative seconds from the record beginning, and for each hour, there is aMarker. Also, there are some rough statistics about each hour. The other sheets are almost the same, except the statistics. See the picture below. With this excel file, you can do more downstream analysis.
- With the selected label file, you can also get the hypnogram. There is a colormap help you specify one color for your hypnogram. Also, by setting the
start timeandend time(the duration should greater than 100 seconds, means end time - start time > 100), you can get the hypnogram for a subset of data. Defaults are 0 forstart timeand 99 forend time, which represents the whole data.
Main window
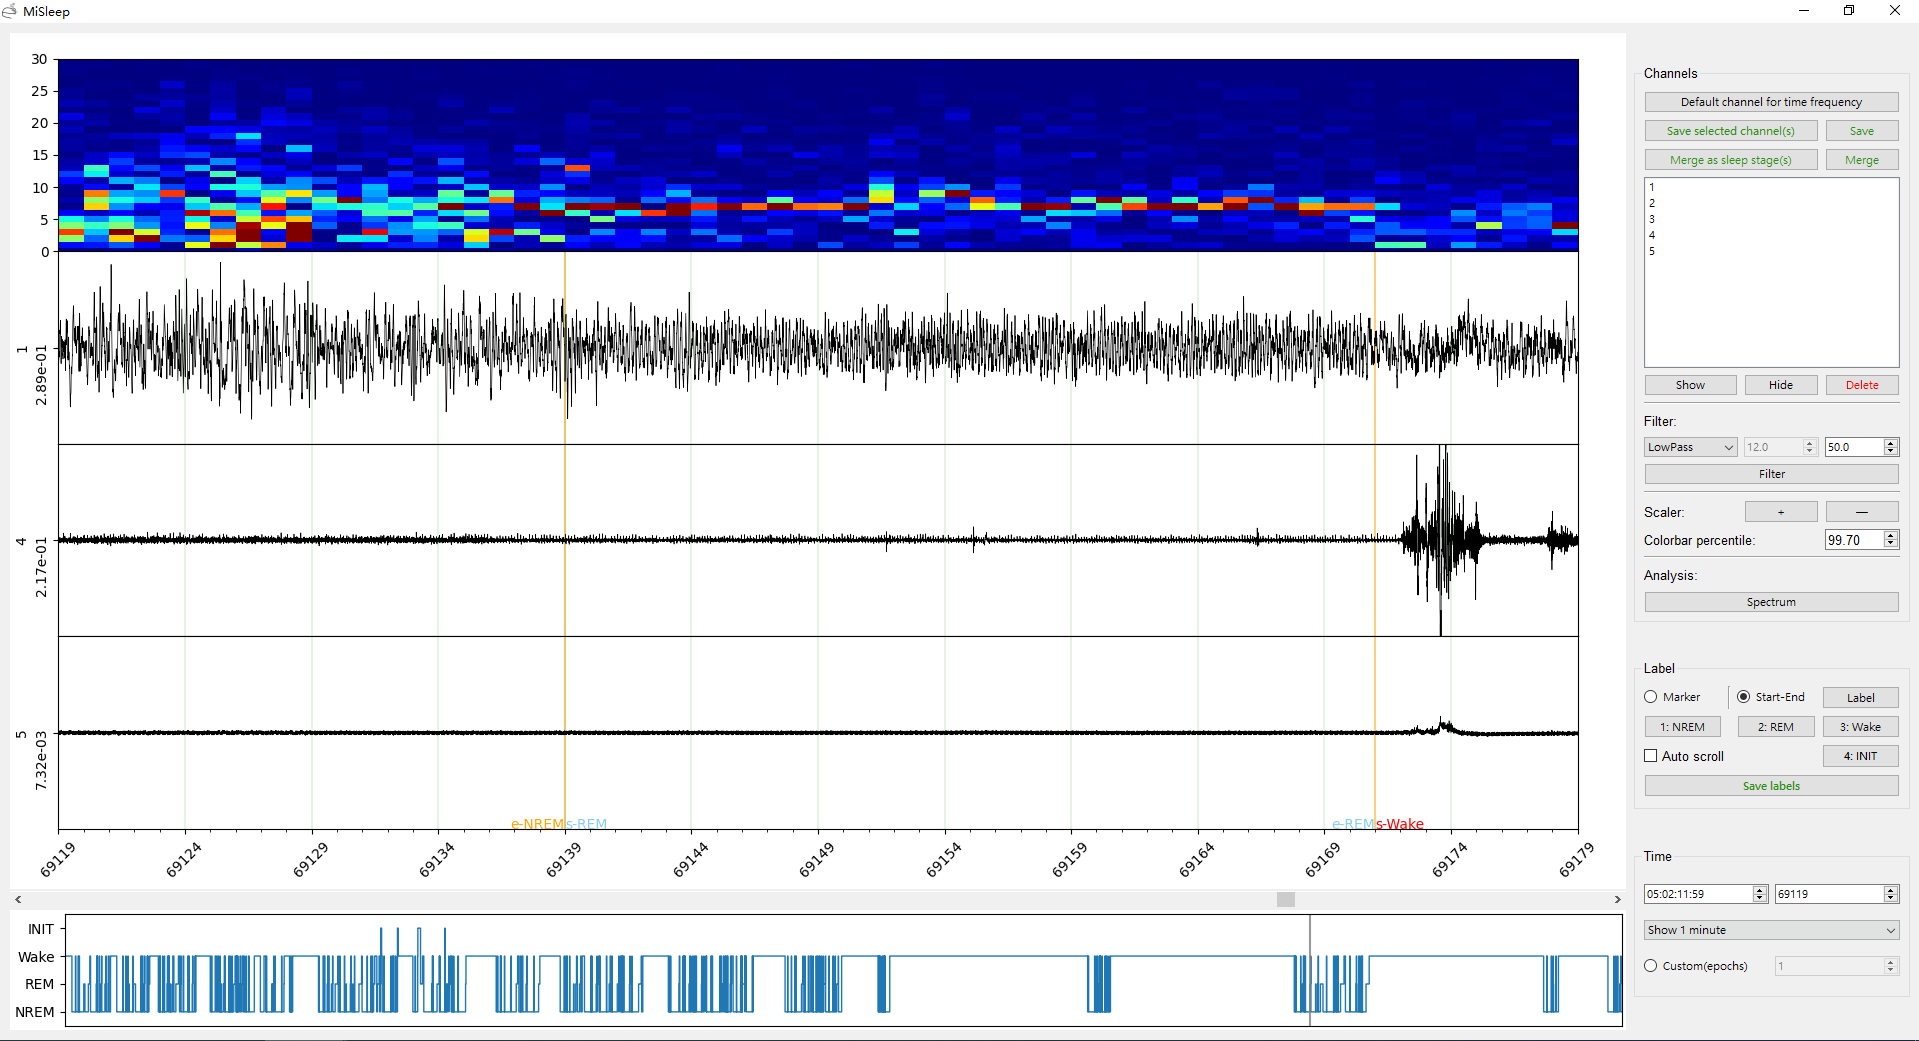
The main window consists of three parts, upper left is the signal area, bottom left is the hypnogram area, and in the right is the toolbox.
Signal area
The signal area shows the signals, spectrum graph, and a slider bar in the bottom.
-
In the top is the Spectrum graph, it shows the power spectral density of each second with different shades of color. You can adjust the color shades percentile in the
toolboxarea, which isColorbar percentile. -
In the middle are the signals. You can choose which channel to show by using
channel controller, which will be introduced in the channel controllor section later. With thescalerin thetoolboxarea, you can adjust the signal to a right scale. -
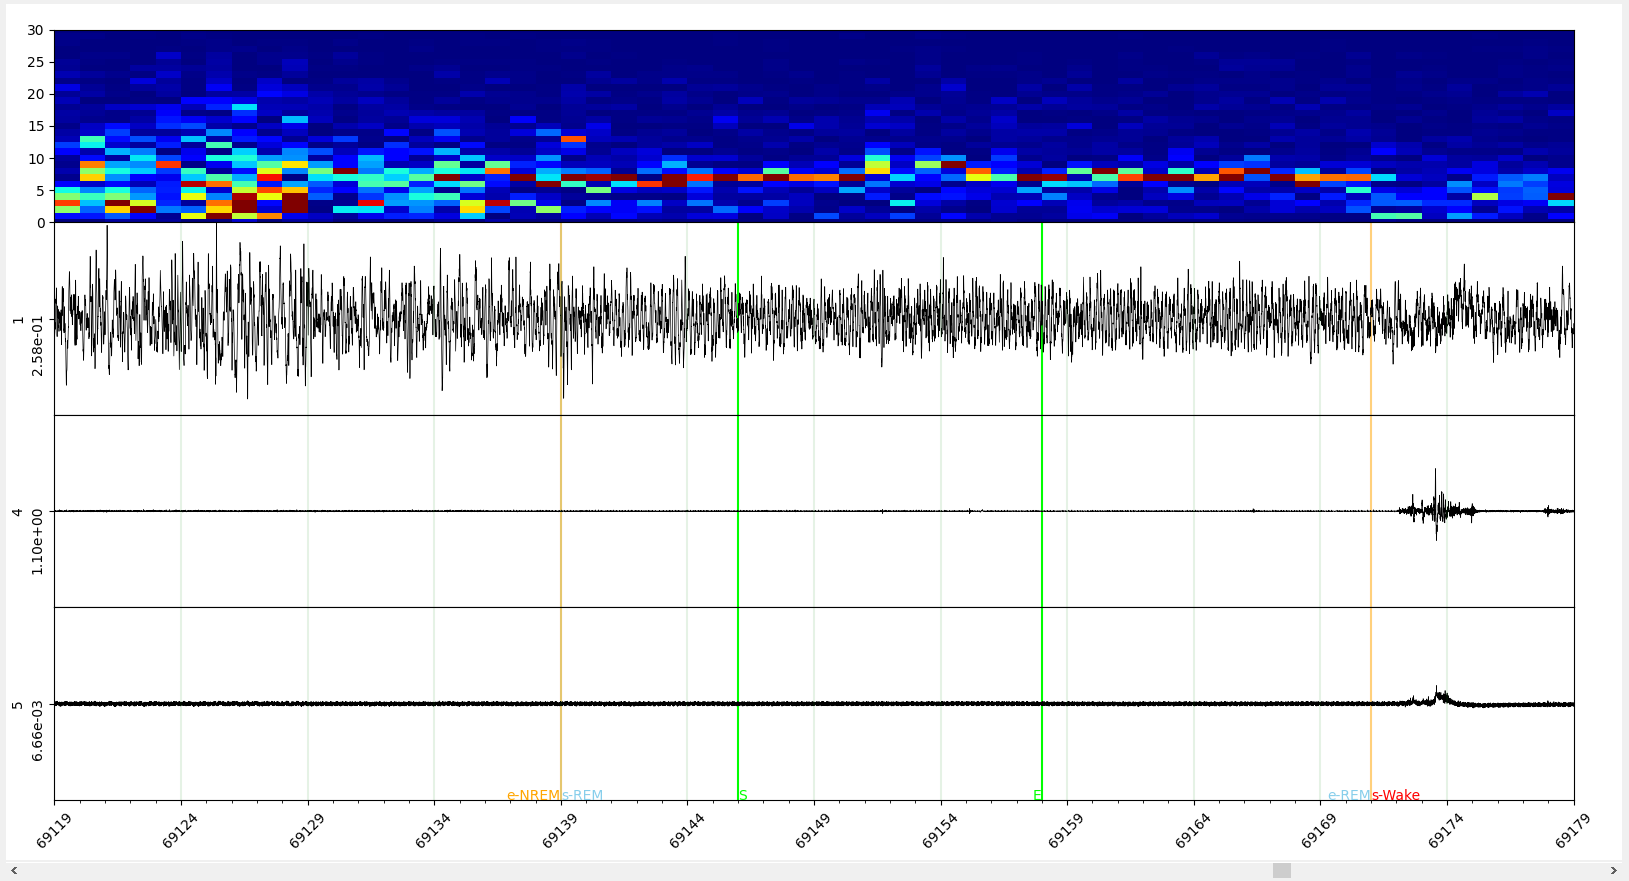
Label function is also largely depends on the signal area, as you can see there are two green lines in the signal area, between the two lines, is the data you just selected, you can label it as a sleep state, or visualize the spectrum. And once you label the selected area as any sleep state, the sleep state name will show in the bottom of each line. For more details, you can check the Label section.
-
In the bottom is the slider bar. You can scroll left/right to go to the previous/next epoch. Page left/right will help you jump to previous/next page, the page (window) duration depends on the time you set in the Time controller. Also you can drag the slider bar to arrive anywhere.
Hypnogram area

The hypnogram shows the sleep state’s change by time. Here it’s four states, which is the same with the Label. You can click anywhere in the hypnogram area, the signal area will jump to the time you just clicked.
Toolbox area
Channel controller
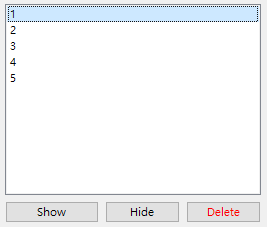
Here shows the initial channels of your data, you can select one or multiple channel to show, hide or delete. If you use the filter function, MiSleep will add a channel here. Many functions of MiSleep will use the channel controller, like analysis, filter, scaler and so on.
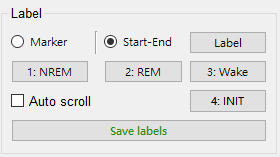
Label
One of the core functions of MiSleep.
- When the
Start-Endmode (default) is selected, you can select an time period by click in the signal area, and there will be two green lines as we mentioned in the Signal area. Then you can choose whether to label this period of time byLabelbutton or the foursleep statebuttons. - By clicking the
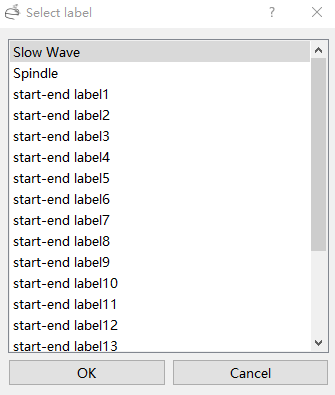
Labelbutton, MiSleep will pop up a select list in the signal area (See picture below). You can choose a label for this period of selected time, or self-define a label name by click the item.
-
If you click the other four sleep state buttons, which are
NRE1: M,2: REM,3: Wake,4: INIT, MiSleep will label the selected time period to the corresponding state Signal area. Or you can use shortcut (The number in each sleep state button) for labeling more quickly. - When you select the
Markermode, you can label a single time by clicking at the time in the signal area, and the following is the same withLabelbutton inStart-Endmode. MiSleep will add a red line for this marker both in the signal area and the hypnogram. - The
Auto scrollcheckbox can help you jump to the end of the labeled signal automatically. - Save labels button should be the one you click the most frequently, though MiSleep will auto save your label every 5 minutes.
Filter
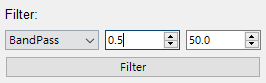
With the filter, you can filter the noises under 0.5 Hz or 1 Hz, and you are labeling spindle, you can use BandPass filter to get the 10~16 Hz data (variance in different paper) from EEG data. Filter will add a new channel in the channel list. For more detail, check the filter data section in EEG analysis workflow.
Analysis
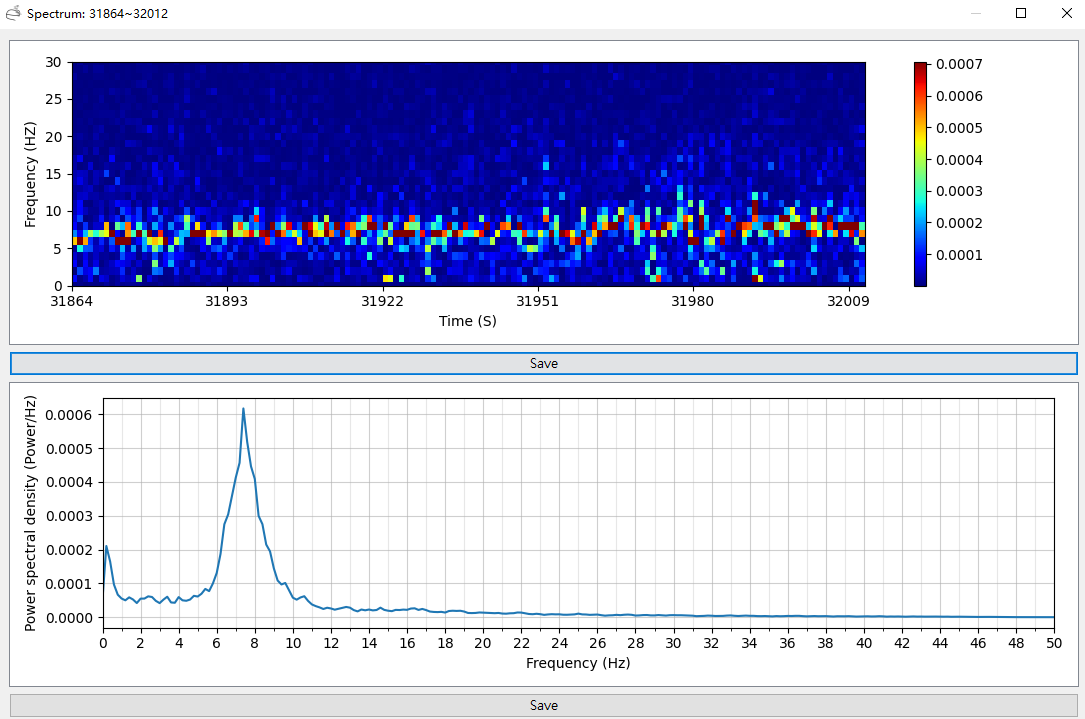
Only works in the Start-End mode in Label. After selecting a signal area, you can click the Spectrum button, MiSleep will pop a dialog (see picture below), there are power spectral density figure and color map of spectrum. You can save them in different format, here we highly recommend .pdf format, which is a vector storage format, so that you can do the downstream edit. For more details, check the spectrum section in EEG analysis workflow.
Time controller
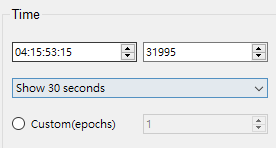
- The date-time editor shows the time of current signal window, the time format is
dd:hh:mm:ss. The number editor is the relative second from the data beginning. You can set a time in the date-time editor or number editor to make the time jump. - A drop box can help you adjust the time duration display in the signal area. There are some high frequency settings, or you can self-define the duration by check the
Custom(epochs)to set a specific duration based on epoch.
Save data

There are two methods you can save your data. One is pure save, you can select some channels to save by selecting some channels in the channel list and click the Save selevted channel(s) button, or just save all the channels to a .mat file by clicking the Save button.
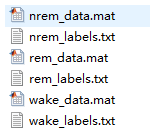
Or, you can merge different sleep states’ data into some individual data files with labels, like when you labeled all the data with sleep states, you can click the Merge button to save 3 (4 when you have some unlabeled data) data files separately (nrem_data.mat, rem_data.mat and wake_data.mat, see picture below). The Merge as sleep stage(s) button means you can select some channels for merging. This can help you do the downstream analysis, such as a specific state’s analysis.