Getting started
Requirements
- Python 3.9 – 3.14
- Core dependencies (installed automatically):
numpy,scipy,matplotlib,pandas,pyedflib,mat73,openpyxl,joblib,scikit-learn - Optional:
PySide6— the graphical user interface (misleep[gui])lightgbm— LightGBM auto-staging (misleep[analysis])torch— causal-transformer auto-staging (misleep[transformer])
Installation
# From PyPI - the base install already includes the PySide6 GUI and all
# core dependencies
pip install misleep

# Everything for a full experience (adds LightGBM auto staging)
pip install "misleep[full]"

# Causal-transformer auto staging (PyTorch, not on all platforms)
pip install "misleep[transformer]"

# Development install from the repository
git clone https://github.com/BryanWang0702/MiSleep.git
cd misleepv3
pip install -e ".[analysis,dev]"
Note for Apple Silicon (macOS):
torchandlightgbmship official wheels for macOS arm64. PySide6 also provides macOS wheels, so the whole stack works out of the box.
Launching the GUI
or, after a regular (non-editable) install:
The first launch creates a per-user configuration file at
~/.misleep/misleep_config.ini (see the config docs).
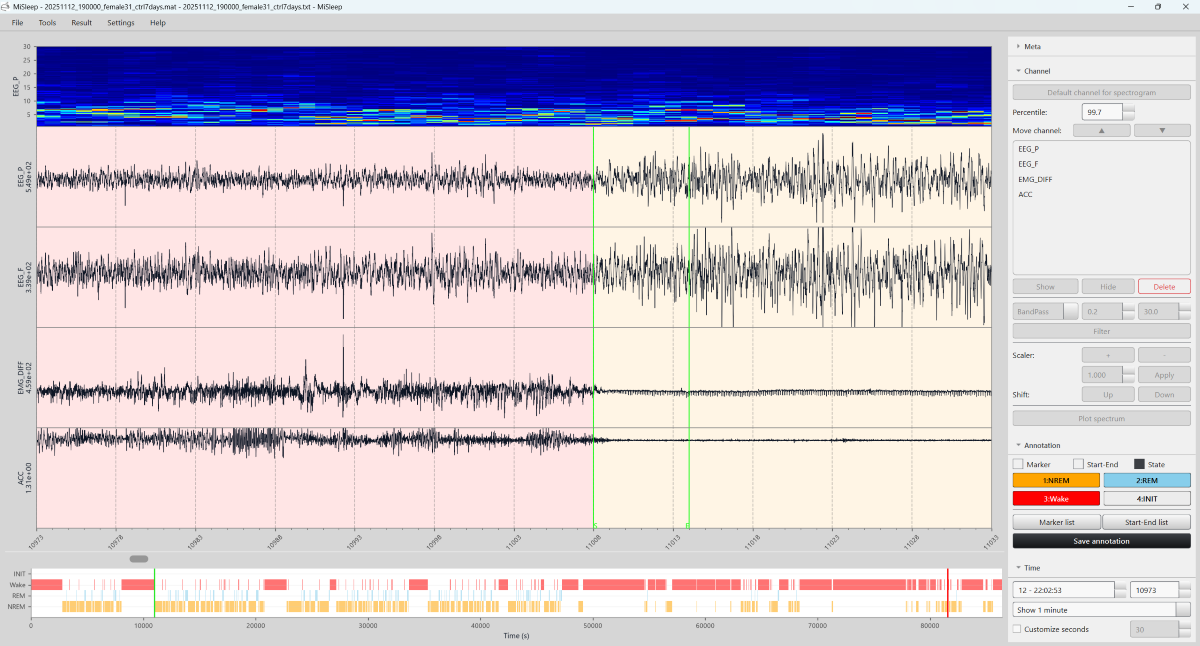
GUI preview
The main window shows the spectrogram strip, one box per channel and the
hypnogram, with a collapsible sidebar (Meta / Channel / Annotation / Time)
on the right. A light and a dark theme are available
(Ctrl+Shift+T to toggle, or Settings → General → Theme /
Color scheme).
Opening files from the command line
misleep data.mat              # open a recording
misleep data.mat anno.txt     # open a recording + its annotation
misleep --data data.edf --anno anno.txt
python -m misleep data.mat    # same via the module
Opening files by double-clicking (Windows)
Register MiSleep as the handler for .mat / .edf files:
After that, double-clicking a .mat or .edf file starts MiSleep with
that file loaded (using pythonw, so no console window flashes).
Annotation .txt files get an "Open with MiSleep" right-click menu
item. Previous handlers are backed up to
~/.misleep/file_assoc_backup.json and restored with:
On macOS / Linux the script prints the manual steps (e.g. duti on
macOS, xdg-mime on Linux); the command-line form works everywhere.
First steps with the library
import misleep as ms

# --- Loading ----------------------------------------------------------
midata = ms.load_mat("recording.mat")   # MATLAB v5/v7/v7.3 or python-saved
midata = ms.load_edf("recording.edf")   # EDF/EDF+

print(midata)                    # duration, channels, sampling rates
print(midata.signals)            # list of 1-D numpy arrays
print(midata.channels)           # channel names
print(midata.sf)                 # sampling frequencies
print(midata.time)               # acquisition time (str)

# --- Working with the data --------------------------------------------
cropped  = midata.crop([0, 3600])                 # first hour
eeg      = midata.pick_chs(["EEG"])               # keep one channel
midata.filter(chans=["EEG"], btype="bandpass", low=0.5, high=30)
midata.differential(chan1="EEG", chan2="REF")     # EEG - REF -> new channel

# --- Annotations ------------------------------------------------------
anno = ms.MiAnnotation(sleep_state=[4] * 3600)    # all "Init" for 1 h
anno = ms.load_misleep_anno("recording.txt")

# --- Analysis ---------------------------------------------------------
freq, psd    = ms.spectrum(midata.signals[0], midata.sf[0])
f, t, Sxx    = ms.spectrogram(midata.signals[0], midata.sf[0])
swa          = ms.SWA_detection(midata.signals[0], midata.sf[0], df=True)
spindles     = ms.spindle_detection(midata.signals[0], midata.sf[0])

# Automatic staging (LightGBM)
pred = ms.auto_stage_gbm(EEG=midata.signals[0], EMG=midata.signals[1],
                         label=anno.sleep_state, sf=midata.sf[0])

# --- Visualization ----------------------------------------------------
fig, ax = ms.plot_signals(midata.signals, sf=midata.sf, ch_names=midata.channels)
fig, ax = ms.plot_hypno(anno.sleep_state)
fig, ax = ms.plot_spectrum(freq, psd)
fig, ax = ms.plot_spectrogram(f, t, Sxx)

# --- Export -----------------------------------------------------------
import datetime
df, analyse_df, start_end_df, marker_df = ms.transfer_result(
    anno, datetime.datetime(2024, 4, 9, 18, 0, 0))
What's next?
- Walk through the user guide to learn the GUI.
- Read about the data formats.
- Browse the examples for runnable scripts.